Дискретизация данных в прогностических моделях эпидемиологии
Дискретизация данных в прогностических моделях эпидемиологии
Аннотация
После начала эпидемии COVID-19 важность прогностических моделей для эпидемиологических данных сильно возросла. Благодаря этому разрабатывается, применяется и апробируется множество различных прогностических моделей, включая те, которые основаны на искусственных нейронных сетях. Модели краткосрочного прогноза способны достаточно точно воспроизводить осцилляции, но не способны сделать долгосрочное предсказание; а модели долгосрочного прогноза страдают от статистического шума входных данных и требуют его подавления. В данной работе мы предлагаем прогностический метод, использующий дискретизацию значений в качестве альтернативы сглаживанию с целью шумоподавления и применяющий лаговую модель. Показано, что такой подход позволяет улучшить качество прогноза даже для нерегулярных данных.
1. Introduction
Since the COVID-19 pandemic beginning, the demand for forecast in epidemiology greatly increased
. The new lethal disease without proven treatment required the estimation of the measures that have had to be taken, as well as a prognosis of the forthcoming ill number. This need pushed the development of the mathematical prognostic models forward. The frequently-reported data as well as the development of the artificial intelligence caused the rise of a large number of neural-network based models, that demonstrate accurate enough results , , , .However, this accuracy turns out to presence for a short-term prognosis (week-length), but is frequently important to know the long-term (month-length) prediction. In long-term prognosis, daily oscillations can be neglected, so just the trend is forecasted. Indeed, oscillations disturb the prognostic model and affects the result. On the other hand, there is an agent-based and cellular automata approach also used in epidemiology
, , that deals with highly discretized data. By this work we propose a method combining discretization and neural-network models, that is capable to yield a long term prediction, and show its efficiency on an example of epidemiological indicators.2. Research methods and principles
To make a prognosis, we use a lag model given by a transformation (the graphical scheme of which is depicted on Figure 1):
As soon as Φ transition function is unknown, it is reasonable to determine it using a neural network as an implicit transition function. To work properly, it should be previously trained on the data available
. Fortunately, the data for COVID-19 contains enough records and makes it possible to train the neural network.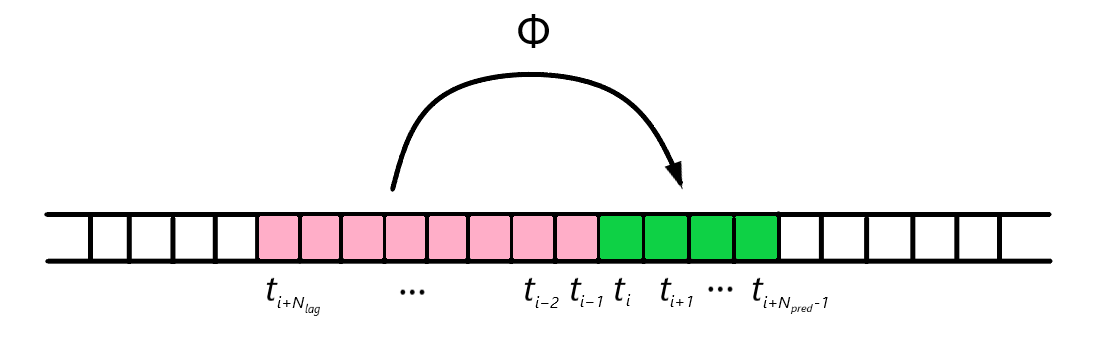
Figure 1 - Scheme of lag prediction
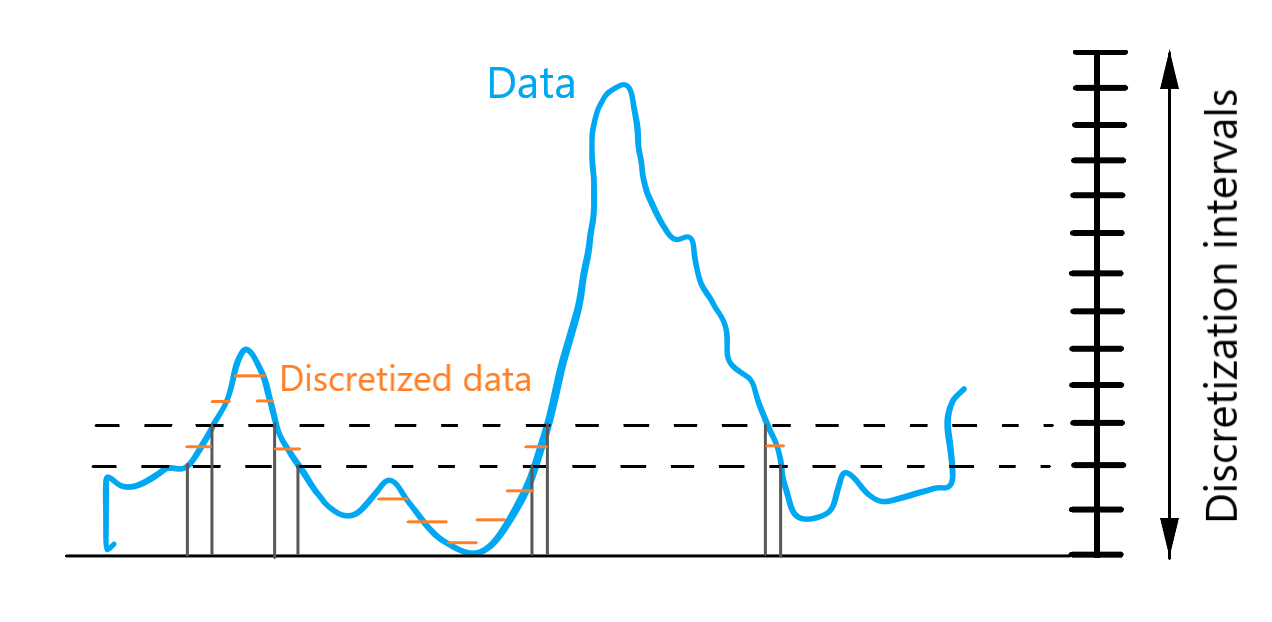
Figure 2 - Scheme of data discretization
1. to obtain a time row of a particular epidemiological indicator (as an example, number
of new recoveries over 100.000 people in Moscow);
2. to interpolate the data on a uniform grid (in fact, records may be done over irregular time interval; uniformity is required for the lag mode (see Figure 1));
3. to split the data into train and verification subsets;
4. to discretize the data over values range, as shown on Figure 2;
5. to train the model;
6. to make a prognosis on a validational range and compare with the real data on it.
As an alternative, to compare with, we will use the same scheme without discretization. Instead of point (3) in the list above, we will use EMD-smoothing
, subtracting several intrinsic modes of the data.3. Main results
As to the model, we selected Nlag = 20 days, Npred = 10 days and neural network with 3 dense internal layers of 50 units each. The prognosis time was of 50 days. As soon as it is greater than , we made several iterations. The data values were sliced into 50 discrete intervals. For the filtered model, 2 intrinsic modes
Figures 3 and 4 demonstrates the prediction results. It is clearly seen that our (discretized) model follows the trend (Figure 4), while the filtered model loose it after 25 days, with the previous prognosis also being not very accurate (Figure 3). Surely, we may complicate and learn further the model for smoothing variant, but the discretized option already yields suitable results.

Figure 3 - Prognosis on regular data: smoothing model
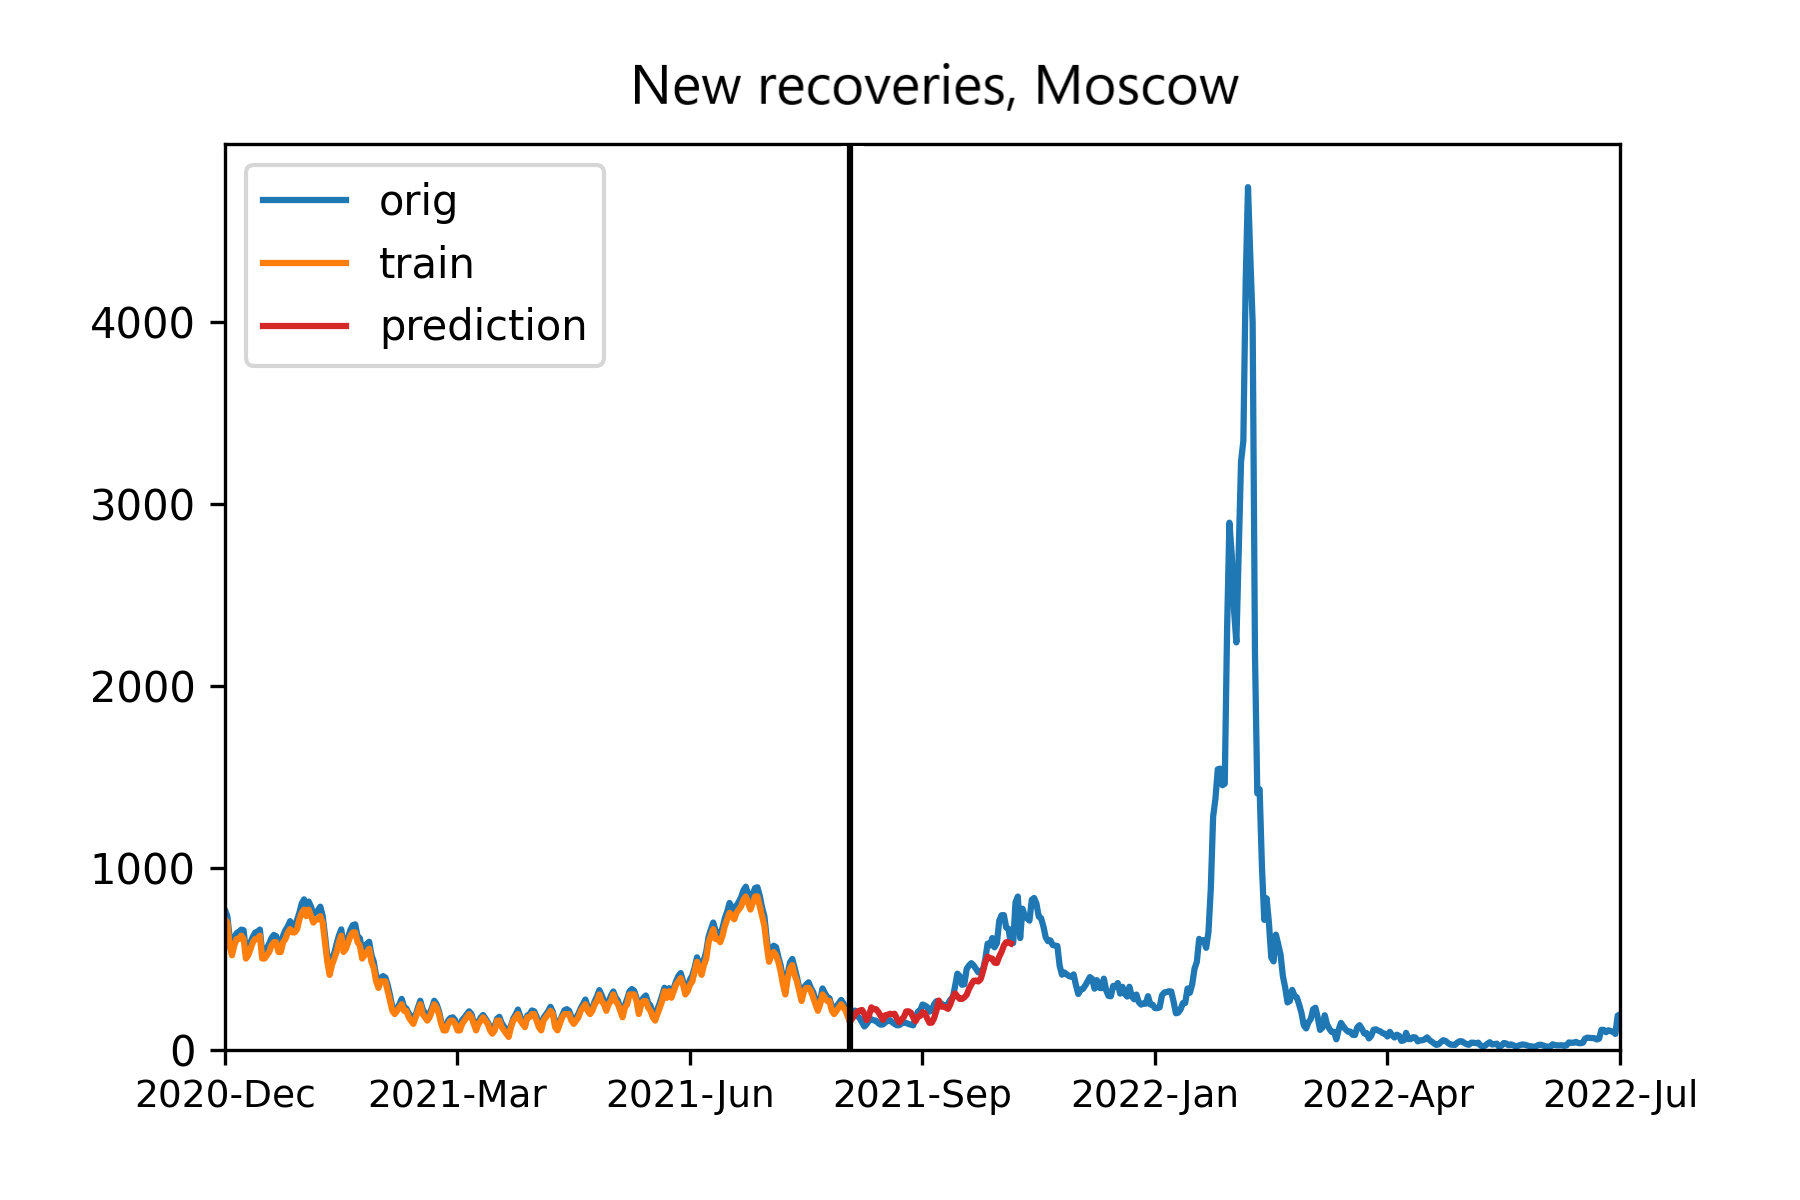
Figure 4 - Prognosis on regular data: discretization model
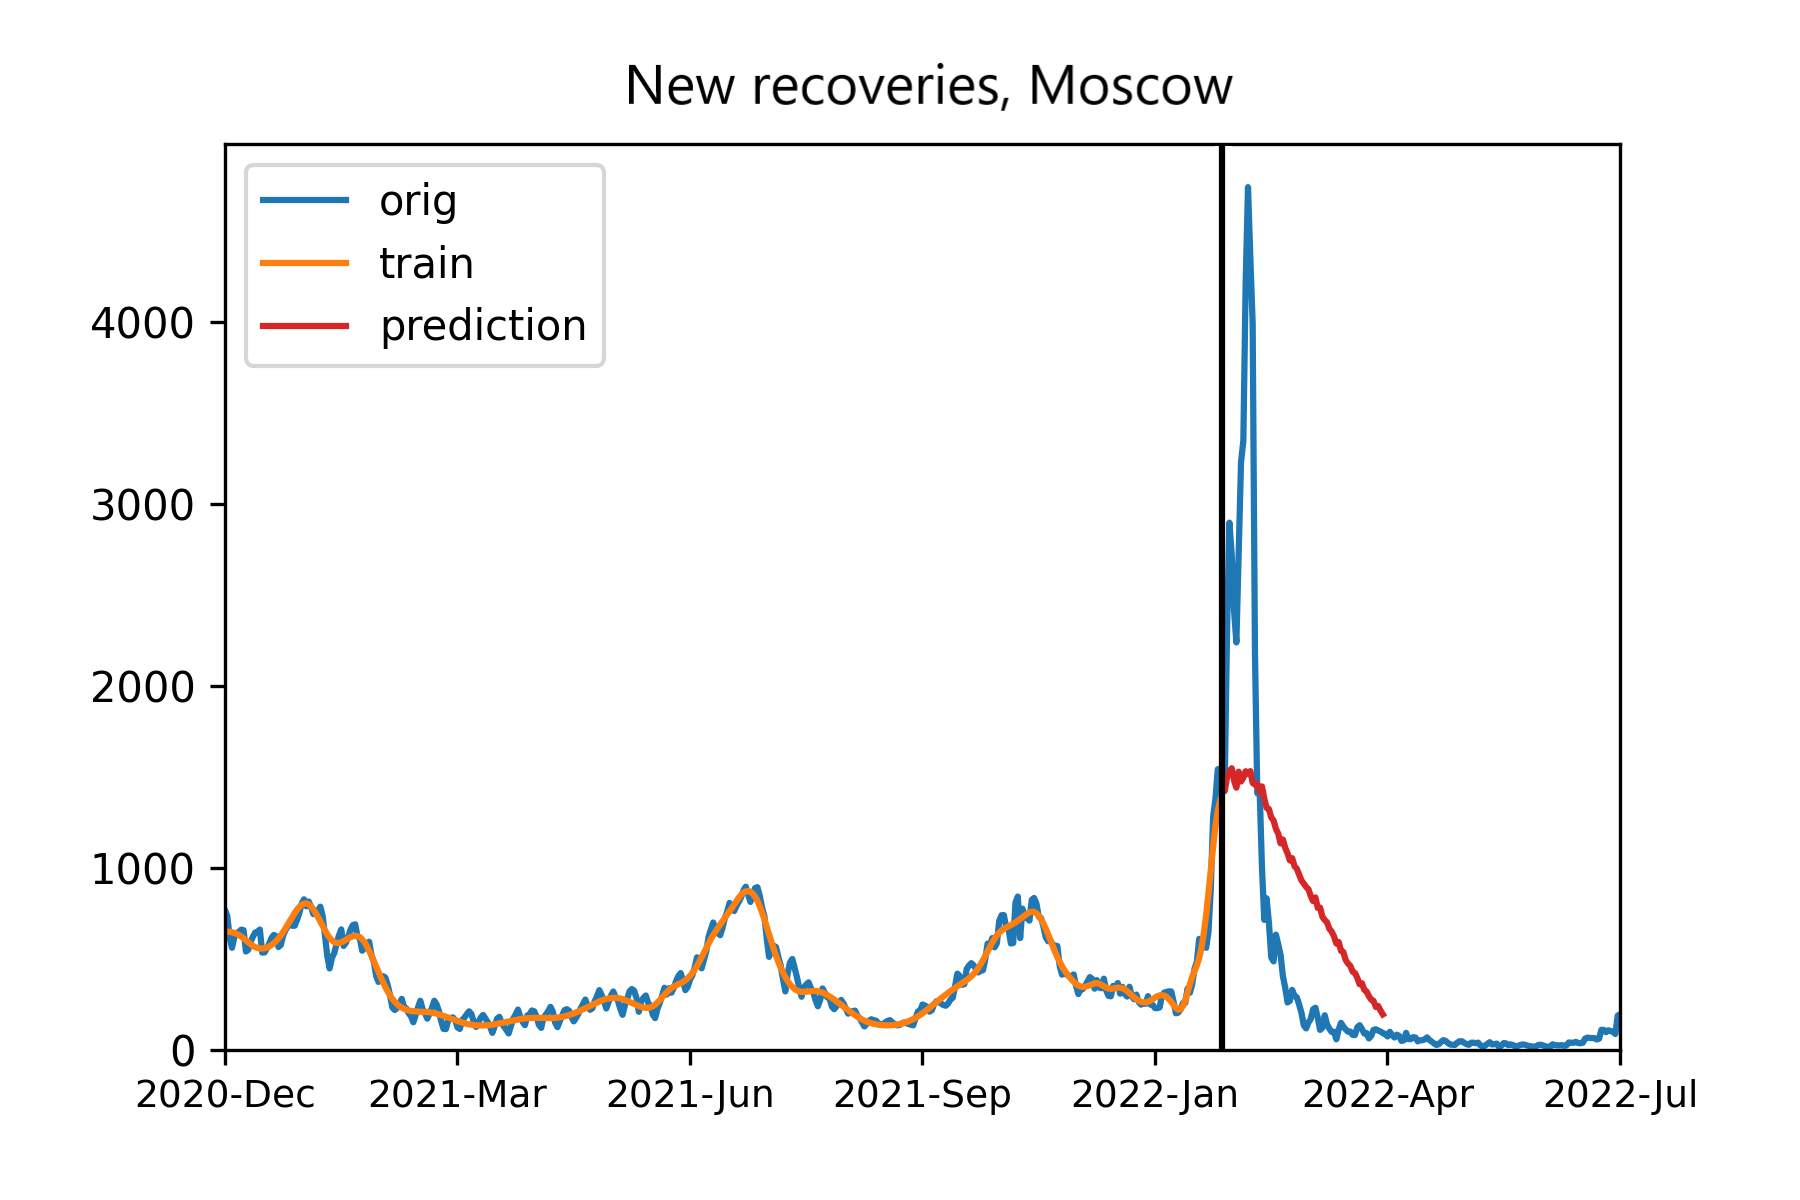
Figure 5 - Prognosis on irregular data: smoothing model
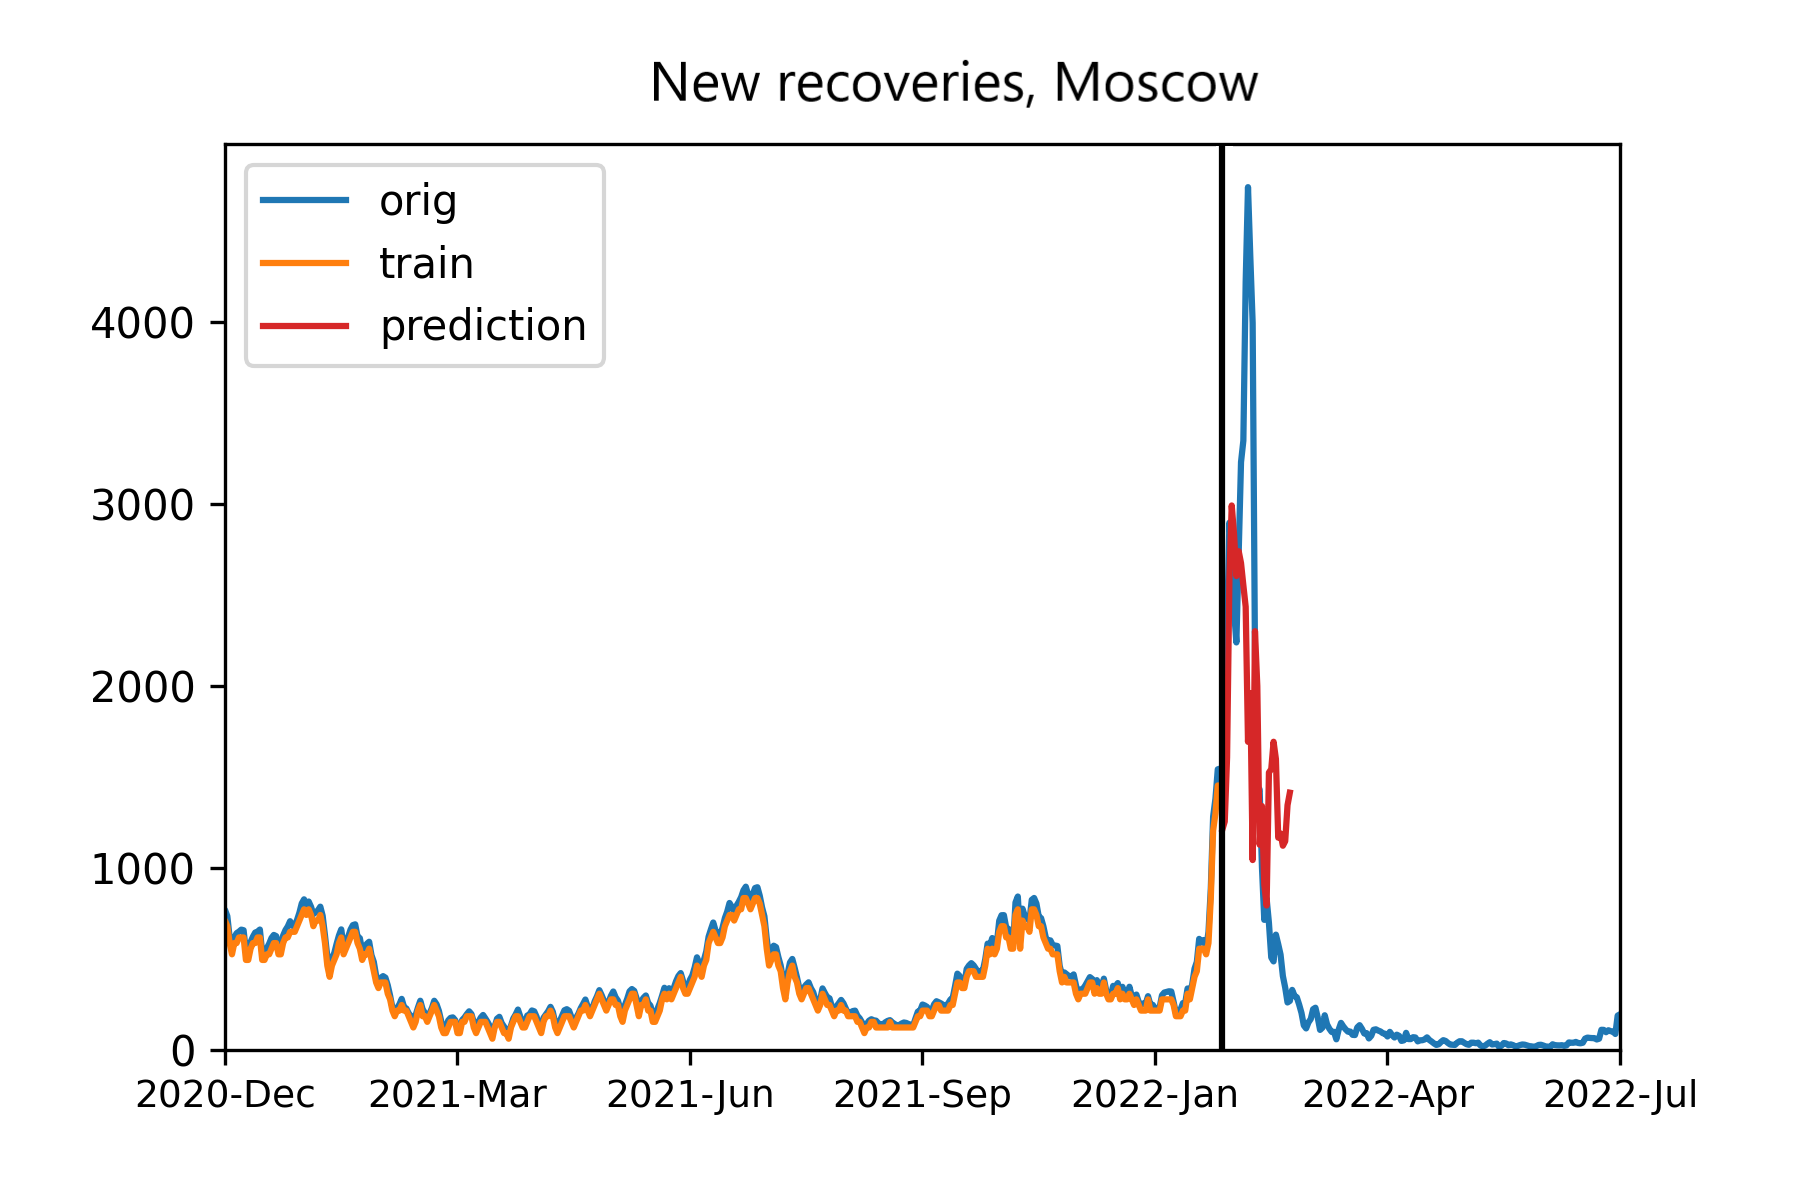
Figure 6 - Prognosis on irregular data: discretization model
4. Conclusion
We applied the data range discretization for the lag prediction model with neural network used for an epidemiological indicator forecast. It is shown that the approach increases the accuracy of the prognosis on the same model architecture and can be used for noise reduction instead of the smoothing. The discretization allows accurate prediction also for irregular data, which is important when the prediction required soon after the condition changed (e.g. after a new virus strain appearance). In the contrary, the same model, but with the smoothing used for noise reduction reproduce worse the regular data and makes inadequate forecast for the irregular ones. As a disadvantage, we may consider some data lack during the discretization, which disallows to use the model proposed if further differentiation may be required. Despite this for the pure prediction, for enough number of discretization intervals, it is not critical, as one can see from our forecasting results. We may recommend it as an alternative of smoothing while development forecast models. However, it should be minded that lag predictor works with a neural network, which requires enough data to be trained. These facts may limit the application of the approach proposed (for instance for common diseases like tuberculosis, whose data typically contains monthly records).