Вернуться к статье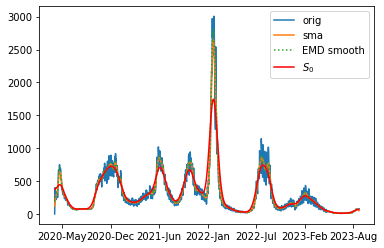
Исследование эпидемиологических данных COVID-19 с использованием вейвлет-анализа
Figure 5 - Illustration of S0 work and different smoothings for Moscow data
Figure 5 - Illustration of S0 work and different smoothings for Moscow data